Hooking up Statsd, Graphite and Nagios to Create Metrics Based Alerts
At Shutl we like to move fast and deploy lots of changes. We push out new code around 70 times a week across about 15 applications. With all these changes happening we need to know quickly if something goes wrong.
Spotting Problems
For a long time we’ve monitored the health of our services with Nagios. This is great because periodically Nagios will make an HTTP connection to an endpoint and make sure it’s returning successfully. It is however a little limited because, unless you specify every route in your application, it only tests a small surface area and that’s usually a healthcheck endpoint which can’t give a full picture of what’s happening with real traffic. This active monitoring will usually be quite low resolution too – it’s probably not going to hit the endpoint more than about once every 30 seconds, maybe even longer.
What we really wanted was a way to see what was happening with real traffic. If we could passively monitor these requests and see when errors were affecting real users then we could spot problems as they occurred.
The Business End of Metrics
As well as application health we also want to track some business metrics so that we can get a holistic picture that the system is doing what it’s supposed to do – if the number of bookings goes down then maybe something isn’t right somewhere. We were writing these numbers into the application logs and parsing the lines to get, for example, the number of jobs booked. This worked and we could have used the same technique to determine the application health but there just might be a better way.
Enter statsd
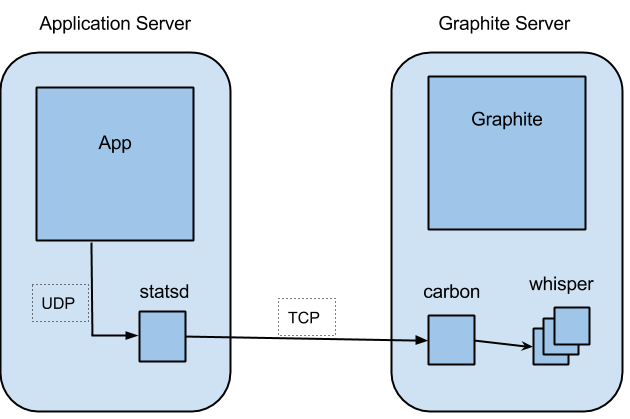
Open sourced by Etsy in 2011, statsd is a small daemon, written in JavaScript and running on NodeJS, which listens on a UDP socket for metric data, such as counters or timing information. This data is stored in memory and every 10 seconds (a configurable interval) it gets flushed out to a back end. In our case this back end is another open source application called Graphite.
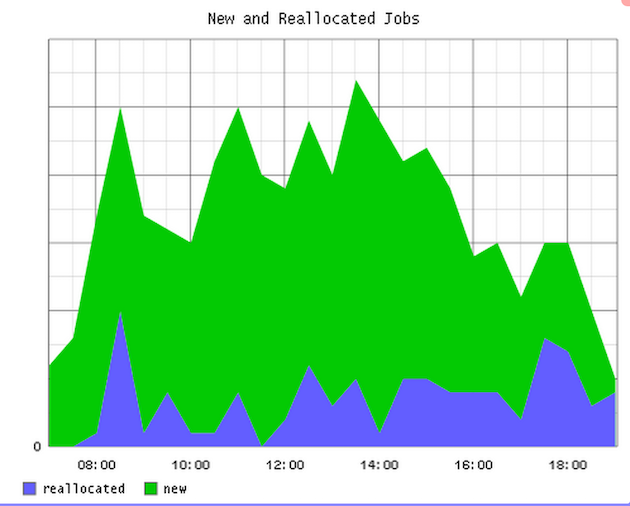
Graphing with Graphite
Graphite is actually made up of three components: the graphite web app, the carbon relay daemon and the whisper data format. The carbon daemon listens on a TCP socket for incoming data which it persists to files in the whisper format. Whisper is a constant size, time series format, similar to RRD. Whisper allows you to store data at different resolutions depending on how old it is. Maybe you want all your data for a year, but you only need it at 10 second resolution for a month, after that it can be aggregated and the resolution taken down to something lower, like 3 minutes. The graphite web app reads the data from these files and allows users to query the values and perform statistical operations on them. The web app also provides a dashboard for drawing graphs, because it’s always nice to see some pretty pictures.

Connecting the Dots
The usual way to set up statsd and Graphite is to run the statsd collector locally on the machine generating the metrics and to have Graphite deployed elsewhere, accepting data from many machines. That way the less reliable UDP communication is done locally while TCP is used across the network, between the nodes.

This gives us a way to get arbitrary metrics from any of our servers, store them in Graphite and draw some graphs so that we can see what’s going on. We use Chef to configure all of our machines so ensuring that a box has statsd installed is just a case of adding the appropriate role.
Now to get metrics onto a graph we just need to connect to a socket on localhost and send some data down it. There are client libraries for the majority of the languages you can think of so most of that work is already done for us. In Ruby, using the most popular client, all we need to do to increase the error count by one is:
statsd = Statsd.new
statsd.increment 'shutl.myapp.bookings.new'
Solving our problems
Going back to the original problem, we want to know when there’s a problem with any of our components. We’d thought about passively monitoring the traffic an application serves so we need some way to turn things like the status code returned to the client and the response time into metrics that statsd and Graphite understand. Fortunately, at least in the case of our Ruby applications, there’s some Rack middleware written by Github which will do all that for us.
Having got metrics for the status codes that the application is returning into Graphite we now need a way to let us know when that number climbs too high. We’re using a script which runs on Nagios and queries the Graphite API, generating an alert when the number of error responses returned exceeds the threshold we provide.
The check, which aggregates errors across all hosts and counts null values (where we didn’t generate any errors) as zero, looks like this:
check_graphite -H https://$HOSTADDRESS$/render -M \
  'transformNull(stats.shutl.example_service.*.status_code.error, 0)' \
  -F 1min -w 0.05 -c 0.1
What’s not so nice?
One of the problems we have with this set up is that Graphite is not simple to deploy. There are a number of parts to it and then steps to follow once it’s installed. We use a Chef cookbook which takes care of that but there were backwards incompatible changes made to that recently which mean we’ll need to do some work when we want to upgrade.
Configuring Graphite can also be tricky. Statsd flushes data to graphite every 10 seconds and this is what the highest-resolution retention should be set to in whisper. If the resolution is lower than that, for example 60 seconds, then only the final value sent during that time will be persisted and some data will be thrown away. It’s not always obvious when this happens so you need to be really attentive to the settings; this is known as the ‘George Michael’ effect as it’s a careless whisper (configuration)…
While we’ve got some issues around setting up Graphite, nothing’s preventing us from using it or forcing us to use something else.
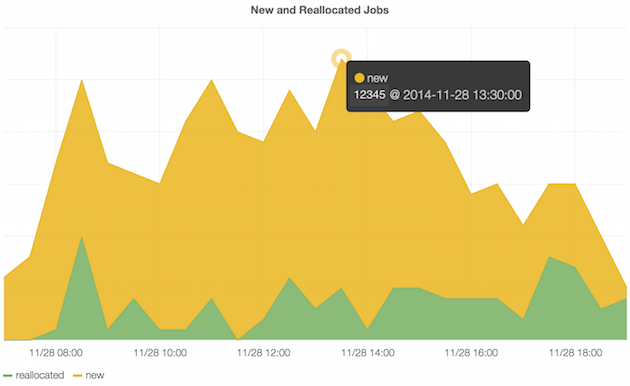
The Graphite dashboard is really powerful but it’s not very pretty; the graphs are static and its user friendliness can leave a little to be desired. To that end we’ve added Grafana into our set up. Grafana is an open source dashboard which runs on the client side and uses the Graphite API to generate interactive graphs.

Grafana can pull metrics out of other data stores other than just Graphite, so if we wanted to swap Graphite out for InfluxDB, for example, then we’d be able to do that without too much trouble.
We’re happy that we’re woken up
All in all we’re happy with our metrics set up and we’re keen to push more data into it to improve the visibility of our system. It’s easy for any developer to push arbitrary metrics, maybe in a rescue block, and draw graphs to show the patterns. We can then raise alerts based on the metrics so we get to know when there’s a problem, even if we’re asleep…
(CC Image by Milan Stankovic)
